Using visualization and annotation tools in CosMx
Using python-based (napari) tool, we can explore multi-layered protein stainings and gene expression of single-cell spatial transcriptomics (CosMx)
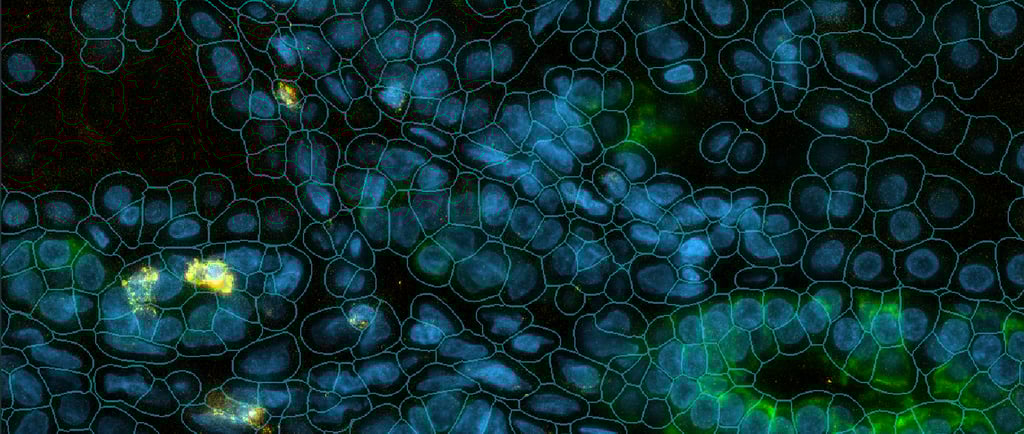
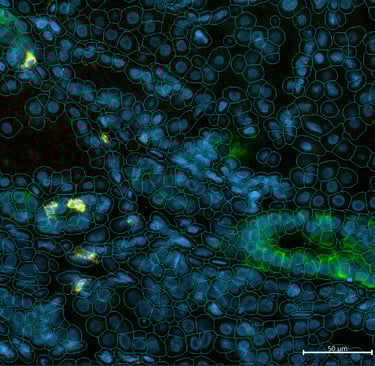
For the Daraxonrasib clinical trial targeting RAS(ON) mutations in pancreatic cancer, I developed a napari-based visualization workflow that integrates multiple data modalities within a single interactive interface. Napari is an open-source, multi-dimensional image viewer designed for scientific Python workflows, providing a flexible platform for visualizing and annotating complex biological datasets. My workflow enables pathologists and researchers to simultaneously overlay CosMx spatial transcriptomic profiles, multiplexed protein immunofluorescence staining, and H&E histological morphology within napari's layered viewing system, facilitating hypothesis generation through interactive exploration of spatial relationships between molecular profiles and tissue architecture.
The primary advantage of this napari-based approach is its ability to bridge multiple data modalities that are typically analyzed in isolation. Pathologists can identify regions of interest based on tissue morphology, immediately examine the corresponding spatial gene expression patterns and protein markers, and annotate these regions for downstream statistical analysis—all within a unified interface. This integration accelerates the iterative process of biological discovery by eliminating the need to switch between separate visualization tools and manually correlate observations across different data types. The workflow's generalizability has proven valuable; it is now applied across multiple CosMx projects at the Hale Center for Pancreatic Cancer Research.
I was able to develop the workflow thanks to the resources provided by Bruker Lab, here is the link to their website if you would like to make your own napari workflow for CosMx data!